Using CloudWatch Log Analytics
Container Insights collects metrics by using performance log events with using Embedded Metric Format stored in CloudWatch Logs. CloudWatch generates several metrics automatically from the logs which you can view in the CloudWatch console. You can also do a deeper analysis of the performance data that is collected by running queries in Log Analytics.
First open the CloudWatch Log Analytics console:
 Open CloudWatch console
Near the top of the screen is the query editor. When you first open Log Analytics this box contains a default query that returns the 20 most recent log events.
When you select a log group and run the query, Log Analytics automatically detects fields in the data in the log group and displays them in Discovered fields in the right pane. It also displays a bar graph of log events in this log group over time. This bar graph shows the distribution of events in the log group that matches your query and time range, not only the events displayed in the table. Select the log group for your EKS cluster that ends with /performance.
In the query editor, replace the default query with the following query and choose Run query.
Make sure you have selected the log group /aws/containerinsights/eks-workshop/performance before running the query, otherwise no results will be returned.
STATS avg(node_cpu_utilization) as avg_node_cpu_utilization by NodeName
| SORT avg_node_cpu_utilization DESC
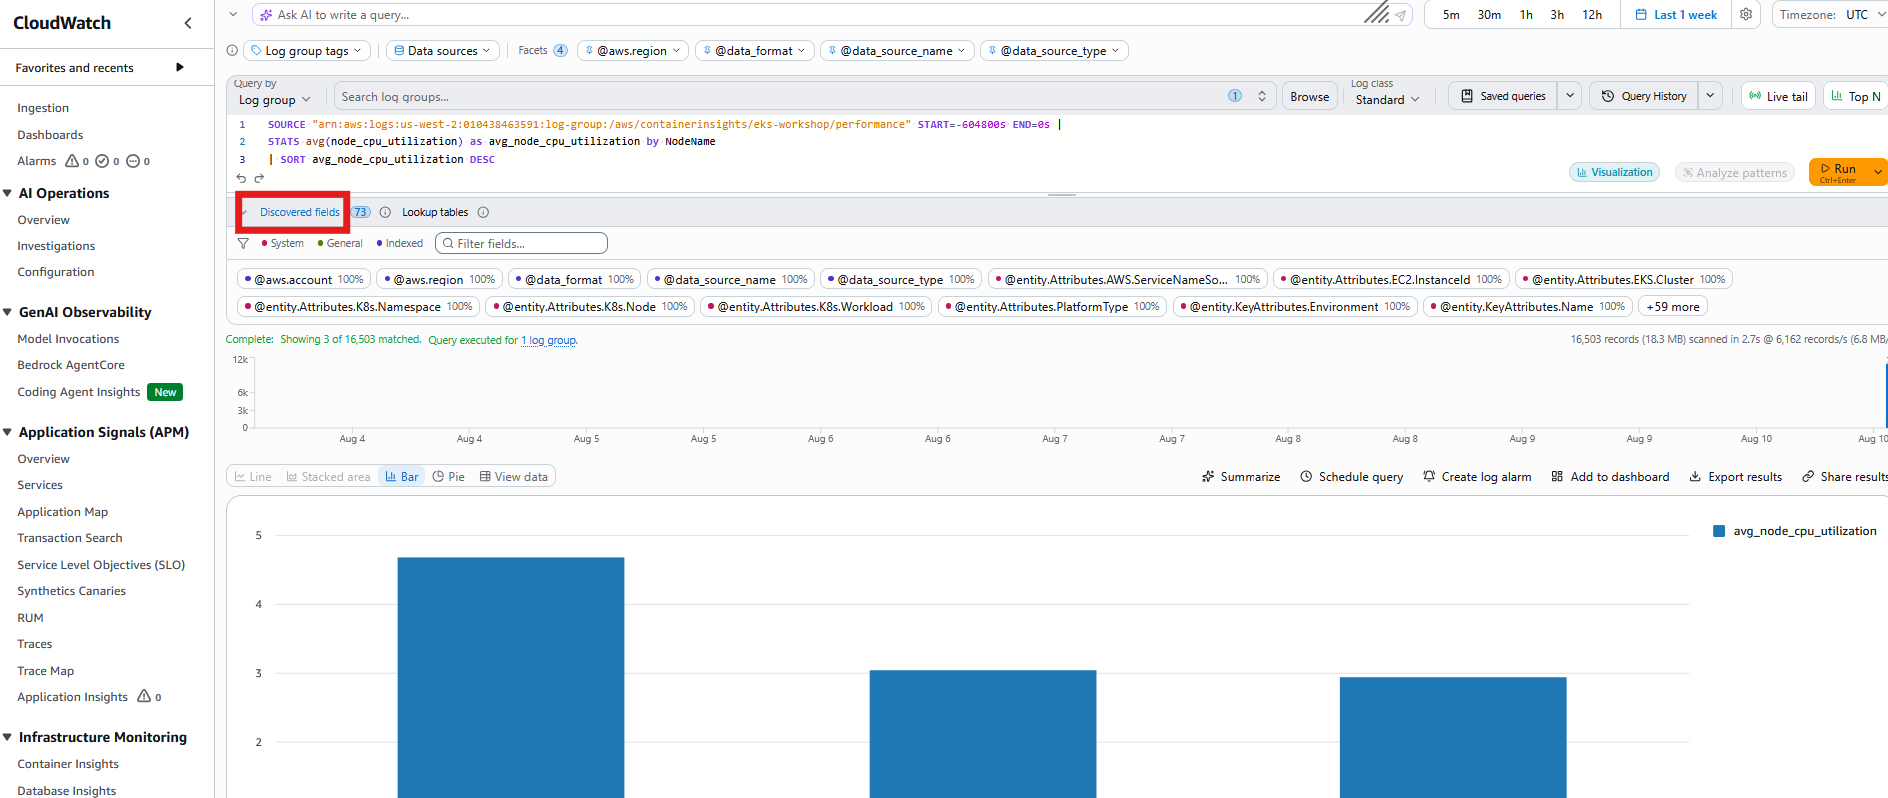
This query shows a list of nodes, sorted by average node CPU utilization.
To try another example, replace that query with another query and choose Run query.
STATS avg(pod_memory_utilization) as avg_pod_memory_utilization by PodName
| SORT avg_pod_memory_utilization DESC
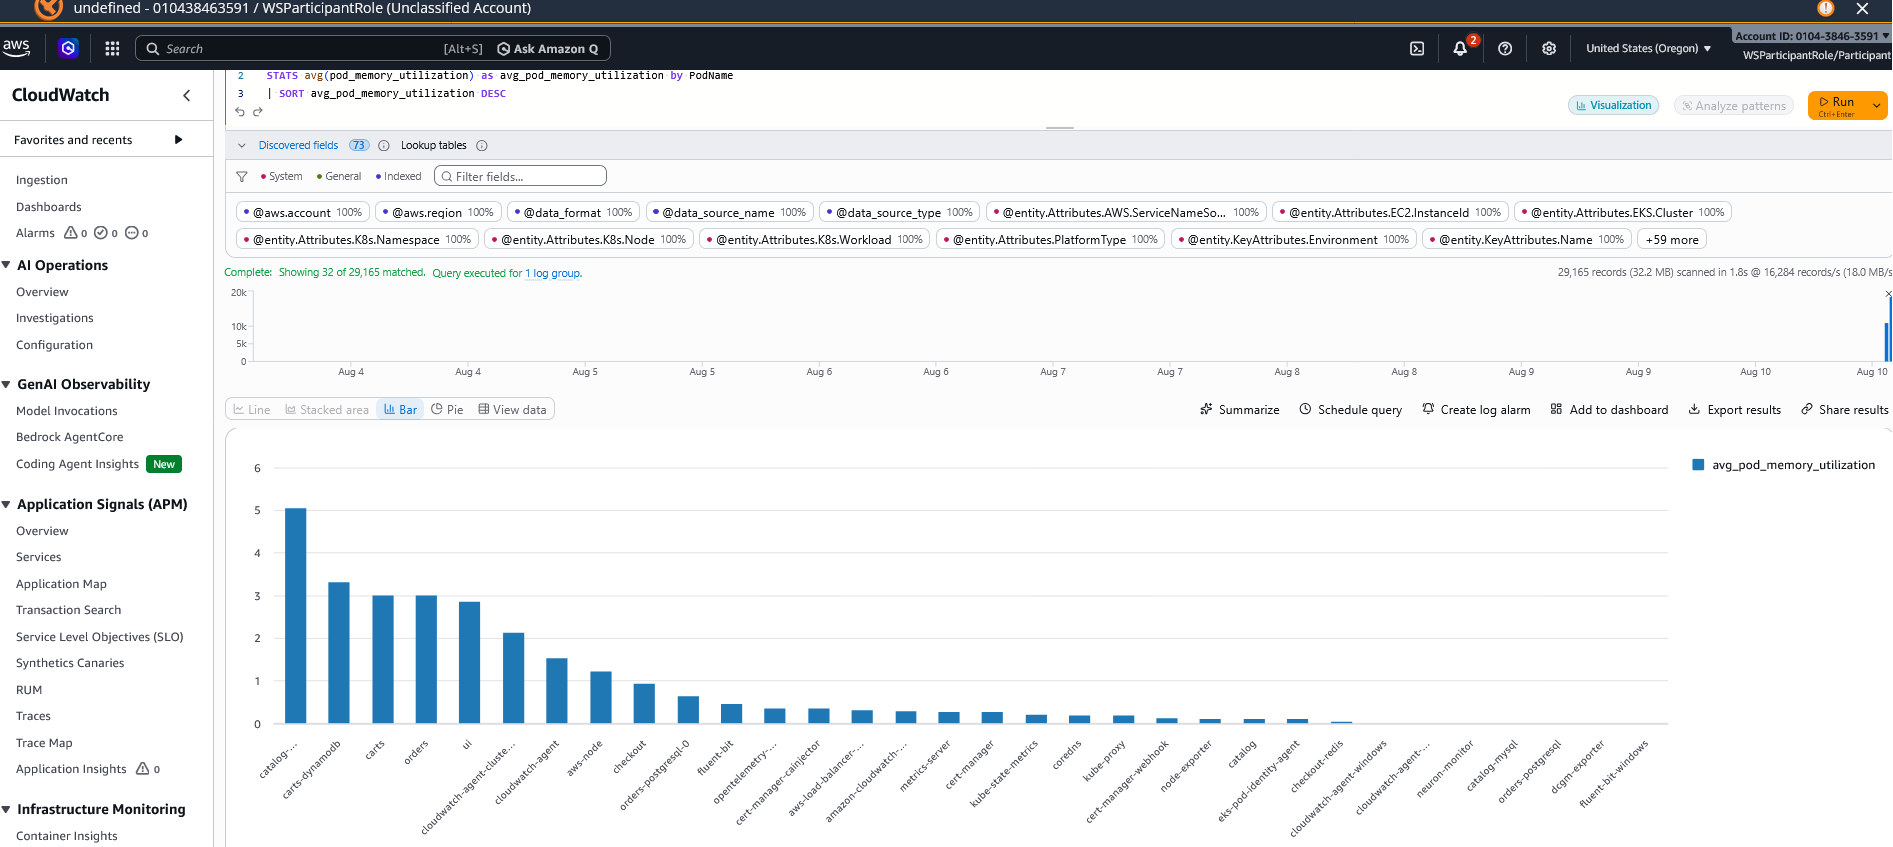
This query displays a list of your pods, sorted by average memory utilization, helping you spot the most memory-hungry workloads in the cluster.
If you want to try another query, you can use include fields in the list at the right of the screen. For more information about query syntax, see CloudWatch Logs Insights Query Syntax.