Application Metrics
In this section we'll look at gaining insight into metrics exposed by our workloads and visualizing those metrics using Amazon CloudWatch. Some examples of these metrics could be:
- System metrics such as Java heap metrics or database connection pool status
- Application metrics related to business KPIs
Each of the components in this workshop have been instrumented to provide Prometheus metrics using libraries relevant to the particular programming language or framework. We can look at an example of these metrics from the orders service like so:
[...]
# HELP jdbc_connections_idle Number of established but idle connections.
# TYPE jdbc_connections_idle gauge
jdbc_connections_idle{name="reader",} 10.0jdbc_connections_idle{name="writer",} 10.0[...]
# HELP watch_orders_total The number of orders placed
# TYPE watch_orders_total counter
watch_orders_total{productId="510a0d7e-8e83-4193-b483-e27e09ddc34d",} 2.0watch_orders_total{productId="808a2de1-1aaa-4c25-a9b9-6612e8f29a38",} 1.0watch_orders_total{productId="*",} 3.0The output from this command is verbose, for the sake of this lab let us focus on the metric watch_orders_total:
watch_orders_total- Application metric - How many orders have been placed through the retail store
Scraping application metrics with the CloudWatch agent
In the previous section the Amazon CloudWatch Observability add-on deployed the CloudWatch agent to collect infrastructure metrics. That same agent is built on OpenTelemetry, and it can also scrape Prometheus endpoints exposed by our applications and publish them to Amazon CloudWatch using Embedded Metric Format (EMF).
Rather than deploying a separate collector, we'll extend the add-on's configuration with an additional OpenTelemetry pipeline that scrapes our application pods. The add-on runs cluster-wide scraping in a dedicated single-replica Deployment named cloudwatch-agent-cluster-scraper (separate from the per-node cloudwatch-agent DaemonSet), so the metrics are collected once without duplicates.
The configuration below adds a Prometheus pipeline to the CloudWatch agent. It is available in your environment at ~/environment/eks-workshop/modules/observability/container-insights/cwagent-prometheus/cloudwatch-agent-prometheus.yaml:
otelContainerInsights:
  enabled: true
agent:
  otelConfig:
    receivers:
      prometheus/appmetrics:
        config:
          global:
            scrape_interval: 30s
            scrape_timeout: 10s
          scrape_configs:
            - job_name: retail-app-pods
              honor_labels: true
              kubernetes_sd_configs:
                - role: pod
                  namespaces:
                    names: [orders]
              relabel_configs:
                - source_labels: [__meta_kubernetes_pod_annotation_prometheus_io_scrape]
                  action: keep
                  regex: true
                - source_labels: [__meta_kubernetes_pod_annotation_prometheus_io_path]
                  action: replace
                  target_label: __metrics_path__
                  regex: (.+)
                - action: labelmap
                  regex: __meta_kubernetes_pod_label_(.+)
                - source_labels: [__meta_kubernetes_namespace]
                  action: replace
                  target_label: namespace
                - source_labels: [__meta_kubernetes_pod_name]
                  action: replace
                  target_label: pod
    processors:
      batch/appmetrics:
        timeout: 30s
    exporters:
      awsemf/appmetrics:
        namespace: ContainerInsights/Prometheus
        log_group_name: /aws/containerinsights/eks-workshop/prometheus
        dimension_rollup_option: NoDimensionRollup
        resource_to_telemetry_conversion:
          enabled: true
        metric_declarations:
          - dimensions: [[pod, productId]]
            metric_name_selectors:
              - ^watch_orders_total$$
    service:
      pipelines:
        metrics/appmetrics:
          receivers: [prometheus/appmetrics]
          processors: [batch/appmetrics]
          exporters: [awsemf/appmetrics]
Let's break down what this configuration does:
- The
prometheus/appmetricsPrometheus receiver discovers pods in theordersnamespace that carry theprometheus.io/scrapeannotation and scrapes their metrics endpoint. - The
awsemf/appmetricsEMF exporter converts the scraped metrics to Embedded Metric Format and sends them to CloudWatch. Themetric_declarationssection selects thewatch_orders_totalmetric and publishes it to theContainerInsights/Prometheusnamespace with the dimensionspodandproductId. - The
metrics/appmetricspipeline wires the receiver, processor and exporter together. The/appmetricssuffix keeps this pipeline separate from the ones the add-on manages automatically.
The $$ in ^watch_orders_total$$ is intentional. The CloudWatch agent expands environment variables in its configuration, so to keep a literal $ (the Prometheus regex end anchor) you must write it as $$.
Apply the configuration by updating the add-on, then wait for it to become active:
Restart the cluster scraper so that it picks up the new scrape job:
Confirm that the scraper has loaded our job:
... "msg":"Scrape job added","jobName":"retail-app-pods"
Now we have the setup complete, we will use the below script to run a load generator which will place orders through the store and generate application metrics:
Open the CloudWatch console and navigate to the Dashboards section:
 Open CloudWatch console
Choose the dashboard Order-Service-Metrics-1 to review the panels within the dashboard:
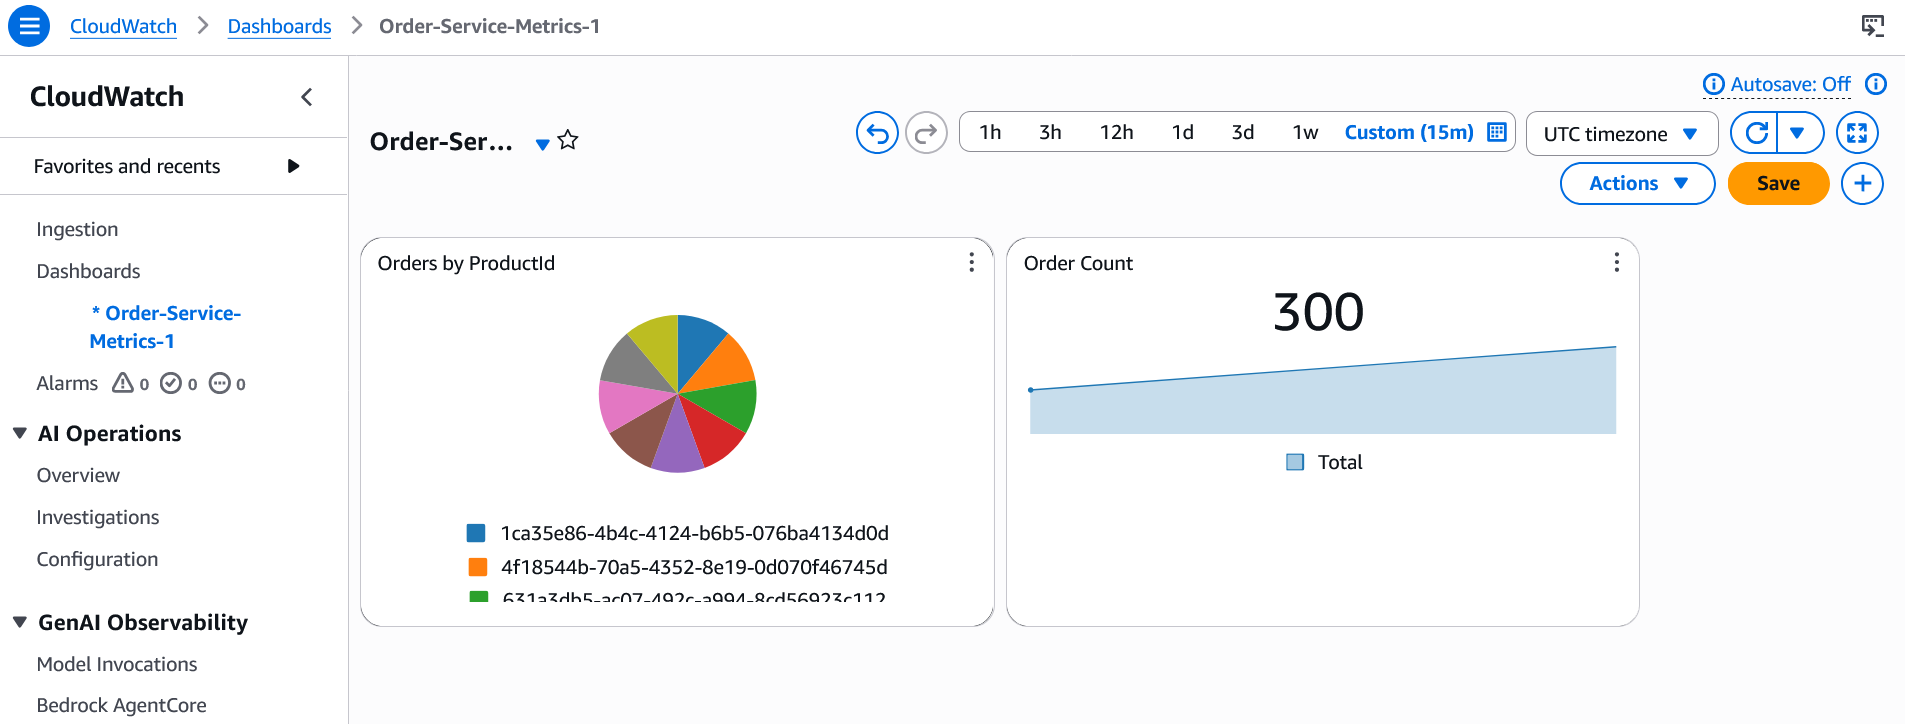
It may take a few minutes for the scraped metrics to appear in CloudWatch.
We can see how the dashboard was configured to query CloudWatch by hovering over the title of the "Orders by Product" panel and clicking the "Edit" button:
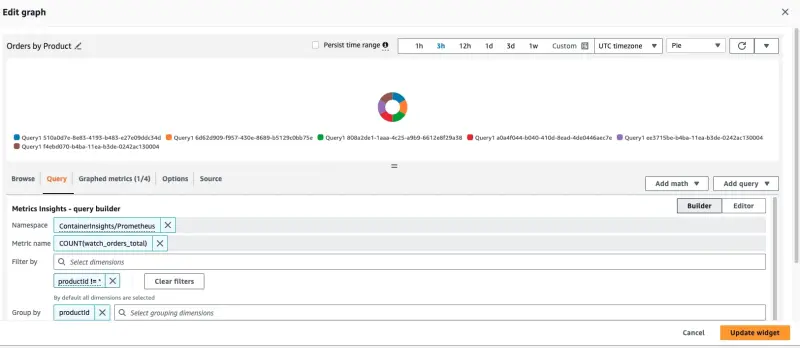
The query used to create this panel is displayed at the bottom of the page:
SELECT COUNT(watch_orders_total) FROM "ContainerInsights/Prometheus" WHERE productId != '*' GROUP BY productId
Which is doing the following:
- Query for the metric
watch_orders_total - Ignore metrics with a
productIdvalue of* - Sum these metrics and group them by
productId
Once you're satisfied with observing the metrics, you can stop the load generator using the below command.